Anoy Mous I am claiming the following.
- The climate scientists are saying that if humanity does does not greatly reduce the CO2 outputs which come from burning of fossil fuels and if we don't change our habits of deforestation, then within about 30 years (or so, maybe within 20 years) the global temperature will be about 2 degrees Celsius higher than pre-industrial levls.
- The climate scientists claim the global temperature is already about 1 degree Celsius higher than pre-industrial levels and that thus the global temperature is now already about one-half of the way to being 2 degrees Celsius above pre-industrial levels.
- Though the charts presented by Vidqun on the surface seem to support his and yours claims about climate change, I am hesitant to agree with those claims, since I have seen other charts (and have read scientific articles) which give a very different impression. Furthermore, the chart called "Greenland GISP2 Ice Core -Temperature Last 10,000 Years" on its right hand side shows dates only up to 95 Years "Before Present" and thus excludes crucial recent data. That is because the chart presented by Vidqun excludes data from the most recent 167 years (not even just the most recent 95 years). That is because the year 2022 is 72 years after the year 1950 (and 95 + 72 equals 167), and 1950 is defined by scientists as "Present" when scientists use the term "Years Before Present", as documented below. During the last 100 years the global CO2 went up much higher than the prior 100 years. Scientists (primarily archaeologists and geologists) use the term "Before Present" in radiometric dating (such as Carbon14 dating) and they define that to mean "Before the year 1950 CE/AD". I learned that from science books. For documentation see https://en.wikipedia.org/wiki/Before_Present which says the following.
"Before Present (BP) years, or "years before present", is a time scale used mainly in archaeology, geology and other scientific disciplines to specify when events occurred relative to the origin of practical radiocarbon dating in the 1950s. Because the "present" time changes, standard practice is to use 1 January 1950 as the commencement date (epoch) of the age scale. The abbreviation "BP" has been interpreted retrospectively as "Before Physics",[1] which refers to the time before nuclear weapons testing artificially altered the proportion of the carbon isotopes in the atmosphere, which scientists must now account for.[2][3]
In a convention that is not always observed, many sources restrict the use of BP dates to those produced with radiocarbon dating .... Radiocarbon dating was first used in 1940. Beginning in 1954, metrologists established 1950 as the origin year for the BP scale for use with radiocarbon dating, using a 1950-based reference sample of oxalic acid."
https://www.crowcanyon.org/education/learn-about-archaeology/archaeological-dating/ says the following. "B.P. (Before the Present) is the number of years before the present. Because the present changes every year, archaeologists, by convention, use A.D. 1950 as their reference. So, 2000 B.P. is the equivalent of 50 B.C."
- Here are some science sources I use for inofmration about CO2 changes and their significant.
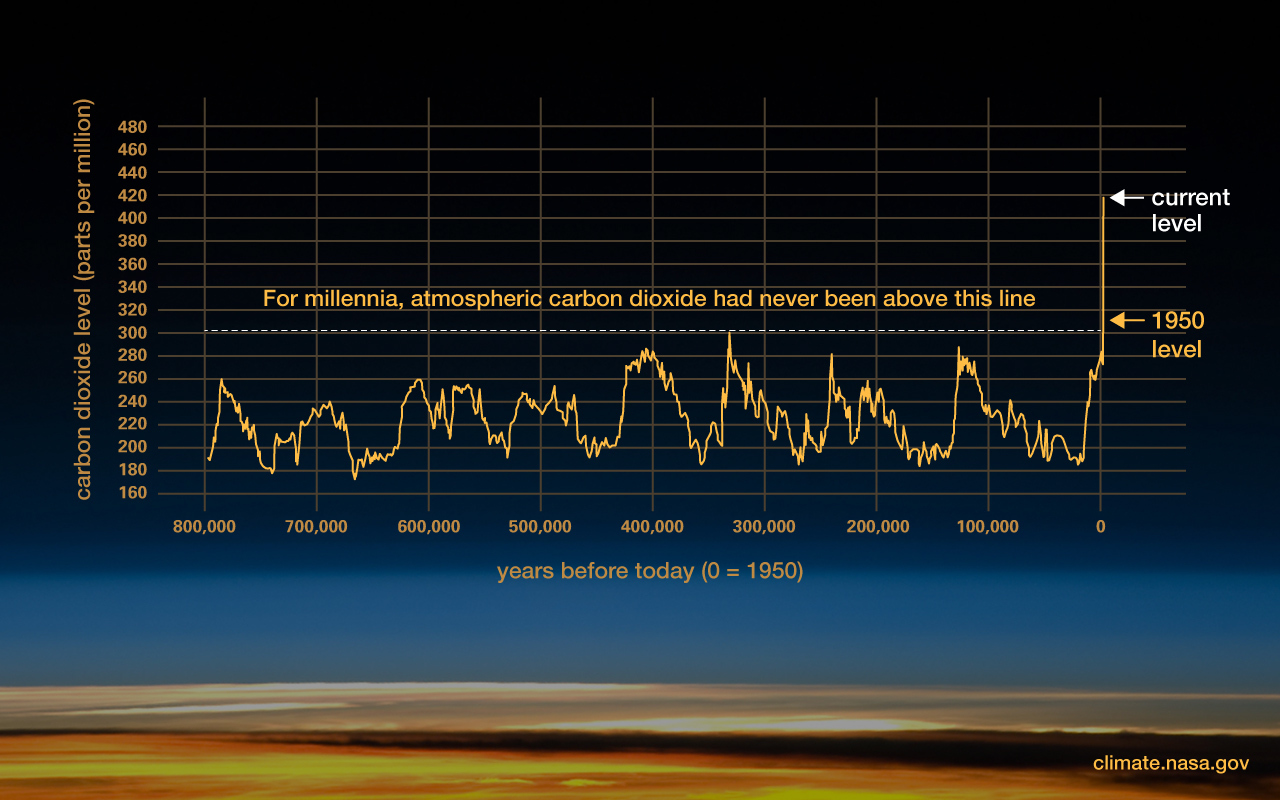
>> https://climate.nasa.gov/rails/active_storage/disk/eyJfcmFpbHMiOnsibWVzc2FnZSI6IkJBaDdDVG9JYTJWNVNTSWhlVFIyTXpad2VtNW1ZM0pwWm01dGFUWjRhakF3Ykc1eFp6bG5hUVk2QmtWVU9oQmthWE53YjNOcGRHbHZia2tpZFdsdWJHbHVaVHNnWm1sc1pXNWhiV1U5SW1Odk1pMW5jbUZ3YUMwd09ETXhNakpmYzJOaGJHVmtYM05qY25WdVkyaGxaQzVxY0djaU95Qm1hV3hsYm1GdFpTbzlWVlJHTFRnbkoyTnZNaTFuY21Gd2FDMHdPRE14TWpKZmMyTmhiR1ZrWDNOamNuVnVZMmhsWkM1cWNHY0dPd1pVT2hGamIyNTBaVzUwWDNSNWNHVkpJZzlwYldGblpTOXFjR1ZuQmpzR1ZEb1JjMlZ5ZG1salpWOXVZVzFsT2dwc2IyTmhiQT09IiwiZXhwIjpudWxsLCJwdXIiOiJibG9iX2tleSJ9fQ==--da2d254573b5caed3cd66f2d68ca7967d74913da/co2-graph-083122_scaled_scrunched.jpg has a grpah of of the carbon dioxide level from 800,000 years before 1950 up to the current day. NOtice the huge spike which took place after 1950 AD/CE and that is far higer than that going back to 800,000 years before the year 1950! Also notice the caption of "years before today (0 = 1950)".
>> https://www.nature.com/articles/news051121-14 says the following.
'Current levels of greenhouse gases in the atmosphere are higher than at any time in the past 650,000 years, say researchers who have finished cataloguing air bubbles trapped for millennia inside Antarctic ice. The record, which extends back over the past eight ice ages, shows that today's concentrations of carbon dioxide and methane far outstrip those in the past.
Atmospheric carbon dioxide levels have risen 200 times faster over the past 50 years than at any other time during this period, says Thomas Stocker of the University of Bern, Switzerland, who led the analysis.
The researchers studied air bubbles preserved in ice drilled from the Antarctic ice sheet as part of the European Project for Ice Coring in Antarctica (EPICA). The ice core represents a logbook of the state of the world's climate (see 'Frozen time') and goes back 210,000 years further than previous records.
After searching ice spanning the period of 390,000-650,000 years before present, Stocker's team has discovered that carbon dioxide levels in the atmosphere did not exceed 290 parts per million during that time. Today, that figure is around 375 parts per million.
The situation is similar for methane: during this period, levels hovered around 600 parts per billion. Today's atmospheric methane concentration is well over 1,700. Stocker and his colleagues report the results in Science1,2.
Unprecedented push
The burning of fossil fuels in the industrial era has pushed greenhouse-gas levels far beyond their natural fluctuations, says Stocker. "This is really something unprecedented," he says. Humans, by releasing fossil fuels from their imprisonment underground, are now adding greenhouse gases to the atmosphere on top of those released as part of natural climate cycles.'
>> https://climate.nasa.gov/vital-signs/carbon-dioxide/ says the following.
"Carbon dioxide (CO2) is an important heat-trapping gas, or greenhouse gas, that comes from the extraction and burning of fossil fuels (such as coal, oil, and natural gas), from wildfires, and from natural processes like volcanic eruptions. The first graph shows atmospheric CO2 levels measured at Mauna Loa Observatory, Hawaii, in recent years, with natural, seasonal changes removed. The second graph shows CO2 levels during Earth’s last three glacial cycles, as captured by air bubbles trapped in ice sheets and glaciers.
Since the beginning of industrial times (in the 18th century), human activities have raised atmospheric CO2 by 50% – meaning the amount of CO2 is now 150% of its value in 1750. This is greater than what naturally happened at the end of the last ice age 20,000 years ago."
>> https://climate.nasa.gov/vital-signs/global-temperature/ says the following.
"This graph shows the change in global surface temperature compared to the long-term average from 1951 to 1980. Nineteen of the hottest years have occurred since 2000, with the exception of 1998. The year 2020 tied with 2016 for the hottest year on record since recordkeeping began in 1880 (source: NASA/GISS). NASA’s analyses generally match independent analyses prepared by the Climatic Research Unit and the National Oceanic and Atmospheric Administration (NOAA)."
>> https://education.nationalgeographic.org/resource/climate-milestone-earths-co2-level-passes-400-ppm/ says the following.
"On May 9, 2013, an instrument near the summit of Mauna Loa in Hawaii recorded a long-awaited climate milestone: the amount of carbon dioxide in the atmosphere there had exceeded 400 parts per million (ppm) for the first time in 55 years of measurement—and probably more than 3 million years of Earth history.
The last time the concentration of Earth's main greenhouse gas reached this mark, horses and camels lived in the high Arctic. Seas were at least 30 feet higher—at a level that today would inundate major cities around the world.
The planet was about 2 to 3 degrees Celsius (3.6 to 5.4 degrees Fahrenheit) warmer. But the Earth then was in the final stage of a prolonged greenhouse epoch, and CO2 concentrations were on their way down. However, the May 2013 reading represented something different. This time, 400 ppm was a milepost on a far more rapid uphill climb toward an uncertain climate future.
...
The last time the concentration of CO2 was as high as 400 ppm was probably in the Pliocene Epoch, between 2.6 and 5.3 million years ago. Until the 20th century, it certainly hadn't exceeded 300 ppm, let alone 400 ppm, for at least 800,000 years. That's how far back scientists have been able to measure CO2 directly in bubbles of ancient air trapped in Antarctic ice cores.
But tens of millions of years ago, CO2 must have been much higher than it is now—there's no other way to explain how warm the Earth was then. In the Eocene, some 50 million years ago, there were alligators and tapirs on Ellesmere Island, which lies off northern Greenland in the Canadian Arctic. They were living in swampy forests like those in the southeastern United States today. CO2 may have been anywhere from two to ten times higher in the Eocene than it is today."
- Though it is true that many millions ago there were times when CO2 levels were much higher than today, it is important to note that much of what is currently dry land (including areas currently highly populated with humans in dense cities) was completely covered with ocean back then! The western and eastern sections of what is now called the USA (where the vast majority of the Democrats and political liberals of the USA live) was covered by ocean water back then. Maybe that is part of the reason why a much smaller percentage of Republicans and conservatives are concerned about climate change (including global warming) than Democrats and liberals are! Furthermore, more than 65 million years ago the continents were in very different locations that now, including at different latitudes are that had a major effect on the temperature of those land masses and sometimes compensating for much higher CO2 levels than present levels.
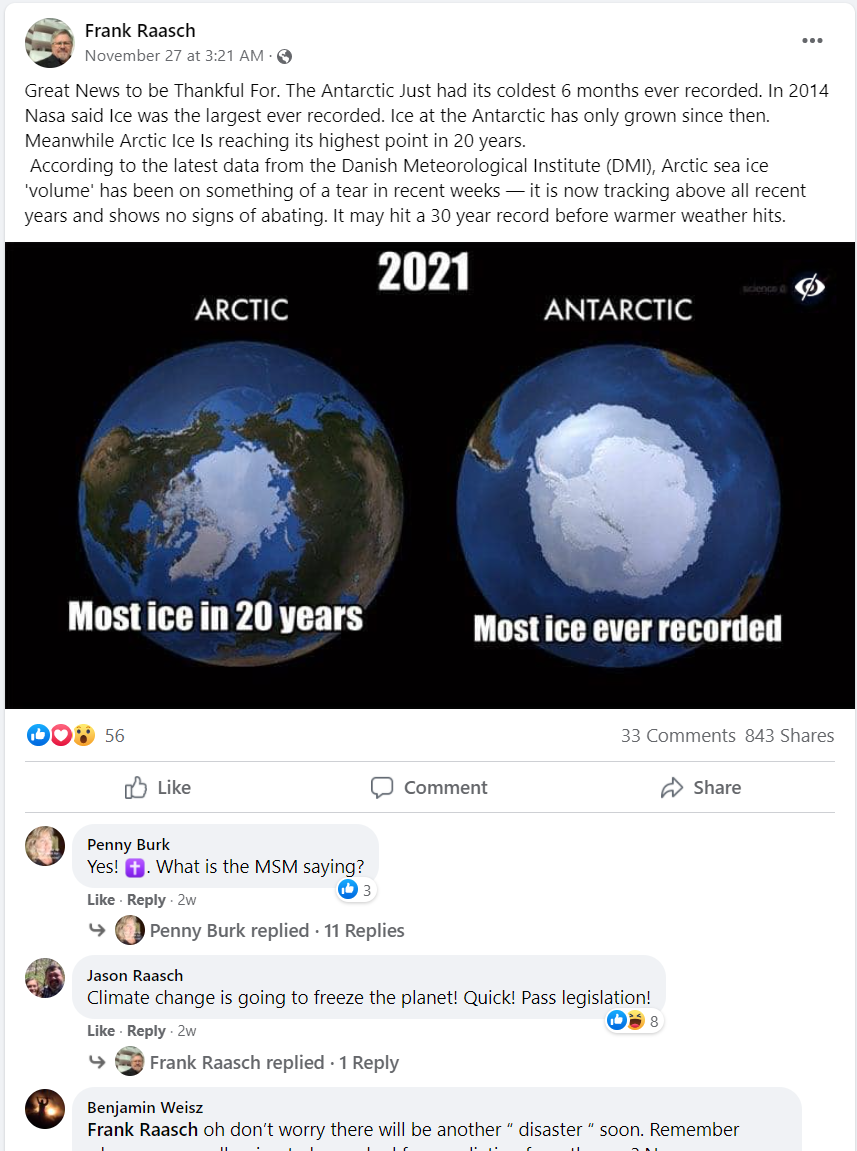
- I very strongly disbelieve Vidqun's claim that "Polar ice has increased, so colder on the Poles" unless he/she is talking about during the cold seasons of the years. That is because science sources say that over a period of years the polar ice has been decreasing, not increasing.
- I believe the above, since about 98% of the climate scientists have now become in agreement that humans are causing most of the recent changes in CO2 and thus most of recent changes of climate change, and that the climate scientists say action must be taken. I also believe the above because I have seen charts and simulations which back it up. Furthermore I recognize and accept that the climate scientists are far more of an expert on this matter than I, and that is another reason why I do not doubt what they say on that topic. I trust scientists' claims about science to a high degree, especially when there is overwhelming agreement among scientists in the relevant field pertaining to the particular scientific claim.
